Movie Visualization Critique & Engineering: K-Means Based Visualization
Critique of a popular visualization subgenre and a demonstration of my improved version 12 Jun 2020Introduction
There are a series of movie “barcode” visualizations that are fairly popular on the internet (I’ve seen them a lot on reddit.com/r/dataisbeautiful). An example that I like is “The average color of every 10th frame of The Lion King (1994) from beginning to end”.

While these barcodes are cool visualizations about the still images (frames) in a movie, I think these visualizations could show richer detail about the colors used in our movie. This post is about my attempt at making a visualization scheme that shows more about how color is used while preserving the artistic qualities.
The Visualization
Since the critique and description of techniques are a bit long, let’s start by looking at a few proposals I have for movie visualizations.
How to read:
Each one-pixel wide (1px) column of this visualization represents a frame sampled from the movie while the colors in each column represent the “significant”1 colors extracted from the frames. Their height is proportional to how frequently the color was used in the frame (i.e the bigger the portion, the more frequently the color appeared). Frames were sampled from the target movie every 24 frames, and the movies I processed were 23.98 frames per second, meaning each column approximates a second in the film. If you’re interested in making your own visualization, here is a link to the repo.
Labeled Barcode
see on imgurThe Original Image Barcode
see on imgurIn addition to creating this psuedo-stacked-area color chart, I tried creating some visualizations derived from the original.
An alternative visualization: The most frequent colors
This was created by taking the top pixel in each column of our original visualization, and creating a new one from it.
see on imgurAn alternative visualization: the least frequent colors
This was created by taking the bottom pixel in each column of our original visualization.
see on imgurThe colors of the movie shown with equal representation
Instead of representing colors by their frequency on the frame, we just represent them all equally. You’ll notice some redundancies (as in very similar) in the colors chosen in some of the columns due to our color extraction method (more on that later).
see on imgurCritique
In addition to the barcode visualization in the introduction - below are two more popular examples (with their links). The titles usually explain the visualization, so I won’t re-describe them to you.
“Blade Runner 2049….. represented by 1600 captures of the movie. Each of these is resized to 1px wide and extracted with the same time interval.”

“The sleek colors of “Joker” by Todd Phillips. One circular line = one frame, for a total of 1600 frames extracted at regular intervals from the movie. Its beginning lies in the middle of the disc and spreads outwards”

Petty Complaints
Some complaints I have are minor. For example, authors describe sampling frames so that the movies are the same barcode length (i.e removing movie length), averaging colors for the sake of prettiness, or (seemingly) clipping out the bottom or top of the frame. These moves seemed to be done to make the visualization more focused on art rather than data - which is “okay”. Movies are art, and movie visualizations can be artistic as well.
Actual Critique
My two main critiques are that these visualizations represent colors differently from human perception, and they don’t show variety in colors. I think that the barcode genre is close to communicating much richer information about colors than they currently do.
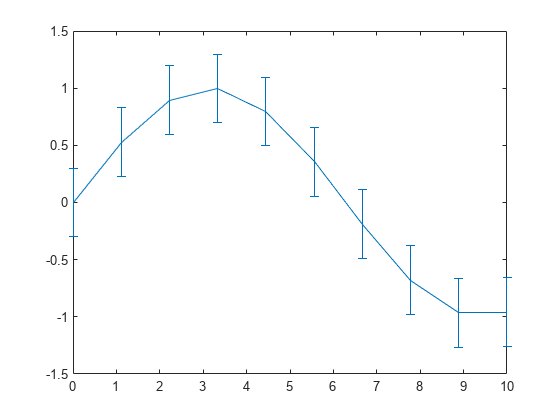
For example, our lion king visualization shows an interesting use of colors over time but fails to show the variety of the palette. If we tried to make an analogy onto a different graph, this is what the “averaging” barcode shows:

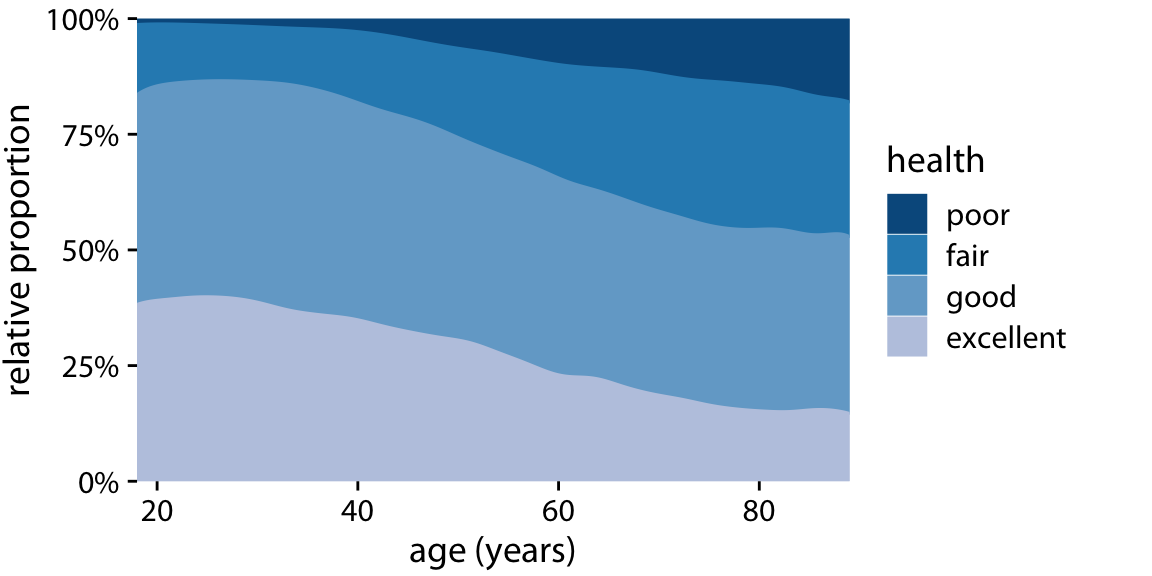
And this is what I would like to see:
The Bladerunner visualization shows color over time but focuses on the content of the frame (through a middle slice), rather than color. I ran an implementation of the barcode visualization described in the blade runner post on “The Simpson’s Movie”. If you examine the slices - you can see the faces if the Simpsons - stitched together (like Homer and Marge). This is a result of the “camera” being focused on a character speaking at those times. These visualizations only capture a small sample of color in center-frame rather than being centered.
see on imgurAveraging misrepresents colors
Averaging colors for movies are a problem because they:
- Alter “lightness” and/or “saturation” due to (0,0,0) and (255,255,255) pixels
- Collapse a variety of colors into a single, unrelated color
To be fair, averaging colors is a perfect representation of mixing them. For example, averaging a half blue and half red image is like mixing red and blue paint. The average will result in purple. The more blue pixels we add, the more violet the mixture becomes; the more red pixels, the pinker it becomes. The problem is averaging is not how humans perceive color. People don’t see a red & blue painting and think “purple”! Moreover, averaging can be a poor metric for certain distribution. Averages for extreme cases (like a skewed histogram or a U-shaped distribution) tell us nothing. A common fix is to use a different measure (like the median) or include information about the variance or skew of the distribution.
Even though these one-pixel slices can capture color schemes used in the film, averaging color alters the palette and fails to capture the different colors in them. This is important for movies as the composition of a frame is dominated by lighting. Whether it’s a scene shot at night, in a bright room, or some gray environment these non-intrusive colors dominate the average. This visualization scheme becomes worse the more colors are added into the frame (like a shot of the rainbow, or a garden, etc).
Below is an Imgur album that demonstrates some of the ideas that I’m talking about. On the left, there is an original image, and on the right is a generated color from averaging them.
Examples of Averaging Colors in ImagesInterpolation isn’t about colors (but the center of the frame)
The blade runner visualization seems to do a better job of showing variety and color. Looking at it, we can see that there are a lot of different colors on the x & y axis!
The only problem is that downsampling frames to a size (image_height x 1) only provides a vertical slice in the middle of the frame. If you apply this process to “The Simpsons Movie”, you can see faces of the characters because the director dedicates time to center framing its characters (long enough to show up in the vis). Interpolation doesn’t provide color information, but rather colors in a small center slice. Below are other examples of this process, I recommend looking at the album below and seeing the interpolation results. If you can’t, I recommend going to Imgur and zooming in to see my point.
Examples of interpolation on imagesCreating the Visualization
The barcodes were created with opencv2, PIL, numpy, and scikit-learn. The annotations and labels were create with matplotlib. Creating these visualizations took 6-7 hours for a 2 hour movie with an 8-core processor at 4.1 GHz (100% usage). Link to the repo: https://github.com/tedkim97/movie_visualizations.
Color Quantization using KMeans
I’ve referred to “extracting colors” with a clustering algorithm, but I’ll be more specific here. When analyzing an image, the number of “colors” will probably be less than the number of unique (R,G,B) values. While humans can semantically understand the number of unique colors in an image (red, turquoise, brown) a computer can have a much harder time doing that. For example, a black image (to a human) could be composed of 40 values close to (0,0,0) such as (0,0,1), (1,0,2), (0,1,0), but a computer can struggle to determine one “color” to systematically describe them all. While I could pause every second and tally the colors used in the film, I would prefer not to do that.
The solution to this problem is to extract colors algorithmically using the “color quantization” approach. The idea is to reduce the number of colors in an image, and representing the image with a reduced (and lossy) color palette (i.e compressing). In our earlier example, we could replace all of the different black pixels with (0,0,0), (0, 2, 0), or (1,0,0).
There are a lot of approaches to quantization, but machine learning (clustering) is a fairly popular choice. The trade-off is that clustering can take a decent amount of time depending on the number of clusters or size of the dataset, and if we’re running a clustering algorithm on several thousand frames of a movie, the overall processing time is long. Below are some examples of color quantization run on some random images/frames.
Comparisons of Average vs Color QuanitifactionMaking Movies more Computable/Computationally Tractable
Another problem is that each individual frame is too large for (relatively quick) processing through quantization. A (1920 x 1080) frame will result in ~2,000,000 million pixels. While having more, high fidelity data is nice - there is a tradeoff.
As a result, I resized frames (with interpolation) into a fourth of their original size. A (1920 x 1080) frame becomes (480 x 270) - which is only ~130,000 pixels. This resizing does result in a loss of image quality, and shifts in the coloring of the pixels, but when I examined the original and resized images, they seemed pretty close.
Demonstration: A short clip from the “2001: The Space Odysesey”
Let’s try a clip from the “Stargate Sequence - 2001: A Space Odyssey” (the old clip has been deleted, so this is a new one) to get a better idea between all of the visualizations. The (new) clip starts from ~2:12 to the end. The sequence is a motion of colored light on a dark background (but you should just watch it yourself). To make the extracted colors more visible, the width of each “slice” in the barcode was increased for each visualization. In addition, the sampling rate was increased.
Space Odyssey Visualizations (sample_rate = 12, slice_width=16)In the average barcode, we see that the dark background has muted the “vibrancy” in each of the colors. Since most of the frames are monochromatic (colors of the same hue), we don’t see how averages collapse color variation. In the interpolated barcode, the reason why the colors are bright is that the center frame is illuminated by a white light. Finally, our extracted color visualization is able to capture the colors used in each frame, but represent the transition in the light streams as well. Using a higher number of cluster centers also doesn’t show a human-perceivable difference in color.
The Gallery (Other Visualizations)
Below is an album with some of the visualizations I created with visualizations done on “Coco”, “Mad Max: Fury Road”, “Despicable Me”, “Shrek”, “The Simpsons Movie”, and “Spider-Man: Into the Spider-Verse”. In addition to different movies, I also chose a preset number of cluster centers to extract colors (k=3, k=5, k=8)2.
The number of clusters does change the visualization, but after 5 clusters there is no significant difference. When there are too many clusters for the dataset, the algorithm will create arbitrary boundaries between the same family of colors (or scikit will throw a warning saying that there are at most X clusters). Fortunately, we won’t notice these artifically close cluster centers in the barcode.
Space Odyssey Visualizations (sample_rate = 12, slice_width=16)Off the bat, looking at a few of these images show that the light prevents us from getting the “pure” color palette I desire. This isn’t very surprising given how lighting plays a big role in live-action and computer graphic films.
Problems with the proposed visualization
This visualization idea is not perfect.
- Aesthetically, the visualization is not as pretty as any of the examples I showed earlier. The pixelation of my version is a bit ugly. If you pay attention to the bottom of some of the visualizations, you’ll see tiny black pixels that were caused by rounding errors (oops).
- Computationally, these visualizations take too long to create - I’m aware of the tradeoff, but my instinct tells me that there is a much better approach to quantizing our movie colors.
- Visually, the “1-pixel” width prevents a closer examination of the movie (unless you zoom in with photoshop or something). This limit could be fixed by adding some interactivity (like zoom or crop) in D3, but that might be done later. Furthermore, the layout of the colors themselves can make understanding the visualization confusing.
Out of the alternative I made, I think all of them (“most frequent”, “least frequent”, “equal representation”) are much cooler, but come at the expense of communicating less information about the movie (and most frequent/less frequent can be a vague visualization without the accompanying explanation).
Finally, I think my approach to fitting information into the barcode form factor is wrong. When I calculated proportion, I made this visualization more of a stacked area graph or a density time series - which is probably more fitting and visually appealing for what I’m trying to do (and I will try… later).
Concessions with Compression
Compression is great and necessary to create these visualizations in a reasonable amount of time, The purist in me sometimes gets upset when I think about not analyzing the original 8k resolution movie. Whenever this happened, I remind myself that I’m already working with an imperfect representation of the original movie (a 1080p version). If I really wanted to visualize the pure version, I would be processing the original 120GB version of each movie from the studio.
To recap moments where we have loss of information:
- Representing colors in photos
- Down-sampling reduces details and can cause small shifts in colors
- KMeans (with an arbitrary K) does not always give you the “best” representation of colors
- I used 1080p movies for processing
Conclusion & Next Steps
In conclusion, I tried improving a genre of barcode visualizations by using some machine learning to process our data. I think I achieved my goal of showing a richer study of colors in movies; however, the visualization is not perfect. As of now, there are quite a few flaws.
In the near-future, I would like to explore other methods of extracting colors from the movie. In these visualizations you can observe how lighting influences our color extraction, this is most clear when we see how the “most frequent” colors often are dark. For example, I’m thinking about applying a TF-IDF (term frequency-inverse document frequency) weighting scheme to a movie - treating the “frames” as documents and the “colors (r,g,b)” as words. The reason why I haven’t done it yet is because programming and optimizing TF-IDF calculations for color is a large commitment, and scikit-learn’s implementation of TF-IDF is focuses (obviously) on language3.
FAQ
What about the black bars?
The black bars aren’t actually a part of the frame - for example a 1080p movie (1920 x 1080) will show as a (1920 x 800) frame or something similar.
How did you source these movies?
Yarghhh me matey (I think you can figure it out from there).
Is this processing technique runnable on a laptop?
Probably not. I have a fairly beefy desktop and it took 7-8 hours to process a 2 hour movie.
What about filtering out common colors (ex: removing (0,0,0) and (255,255,255) pixels)?
I’ve thought about it, and it’s feasible to do (ex: filtering out colors whose distance from (0,0,0) or (255,255,255) is less than 10). The problem is that it doesn’t catch a fairly significant amount of pixels that aren’t pitch black (0,0,0) but effectively so, such as (0,15,3) or (5,12,1).
What about representing color variance (through a standard deviation) in colors to augment the “averaging” barcode?
I tried representing a standard deviation for each R, G, B vector, and creating a color gradient based off of that. I struggled to think of a clear way of visualizing this in a barcode format, so I’m adding this to a list of “TODO’s”
What about exploring with other color spaces (HSV, HSL, CIELab, etc?)
I thought about it, and I am still looking into it. At the moment it seemed easier to work everything in a simple R, G, B vector. Even though alternative color spaces and conversions are relatively simple, it still takes a lot of effort adjusting.
I’ve also thought about using k-means with an alternative distance metric, or maybe a distance metric specific to color (like a modern CIE distance metric). However, KMeans is not guaranteed to converge with an arbitrary measure of distance.
What about an alternative clustering method?
I’ve thought about spectral clustering (but it doesn’t seems overkill for this problem), and I’m aware of other clustering methods out there - but I have not experimented with other methods.
Code & Stuff
Sources & Links
Machine Learning Related Links
Blogpost on Finding Dominant Colors in Image
Another blogpost on Finding Dominant Colors in a Movie Poster
An example of TF-IDF on color!
A corresponding kaggle notebook
Various Barcode Related Things
Site that sells average color barcodes, Tumblr blog of barcodes, Someone elses code, Barcode generating software!, A site that I used to validate my test vis, Reddit post, Another reddit post, Another reddit post, Another reddit post, Even more, I was not exaggerating when I said these were popular on the internet,
Footnotes
-
“Significant” as in colors extracted from a clustering algorithm. ↩
-
There wasn’t a huge rationale behind the choices of these movies, these were the movies that came to mind when I thought “movies with distinct colors”. ↩
-
My last resort is hardcoding (R,G,B) tuples as words and jamming them into scikit-learn). ↩