Hip-Hop's Diss Tracks As Graphs (or Networks)
Analyzing beef in a genre 17 Jan 2021Introduction
Over the weekend, I decided to construct diss tracks as graphs (or networks), analyze the results, and visualize them (not in that order). I was inspired by this New York Times visualization on the Oscars, and I thought I would take a crack at doing something similar.
So everyone is on the same page, “diss tracks” are songs meant to verbally attack/disrespect another artist. The writer will usually reference their target’s appearances, discography, controversies, or history to insult them. The diss tracks I remember are in hip-hop, but the archetype is not exclusive to hip hop. For example, “The Story Of Adidon” is a diss track where Pusha T responds to Drake’s diss track Duppy Freestyle”, exposing Drake’s (at the time) hidden child. There’s more to it, so I recommend looking through an explanation if you’re curious.
I’ve sourced a list of diss tracks from this Wikipedia article and this Complex Top 50 List. Read more if you want to see an interactive version, graph statistics, and notes about the data.
Disclaimer: Incomplete Dataset
The dataset I’m using to visualize this information isn’t complete. When I started, I assumed that there would be a deeply descriptive and well cited catalog of all diss tracks in history, but there isn’t. Unfortunately, I don’t think I have the knowledge or energy to compile a comprehensive list of notable diss tracks throughout history. As a result, I combined together some results from Wikipedia and Complex to form a list. The graph only represents a sample of diss tracks - I’m sure there are plenty of songs out there that I’ve missed. I’ll upload my data on a later date Here’s a link to the gist with d3 snippet and data.
An Interactive Visualization
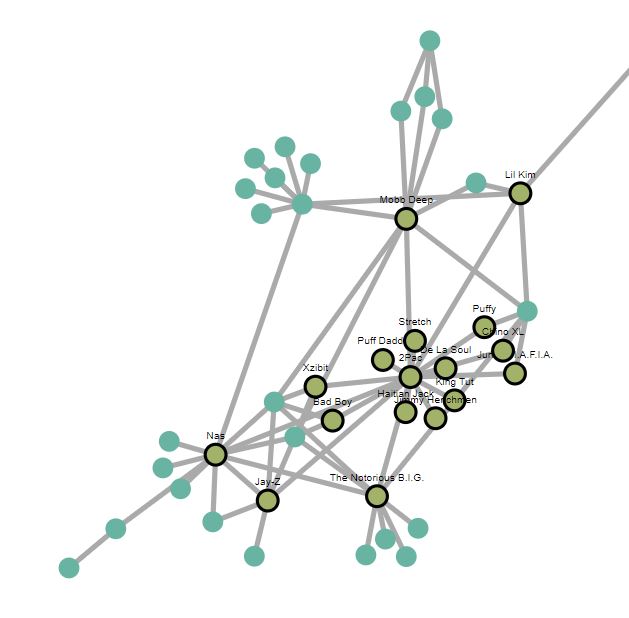
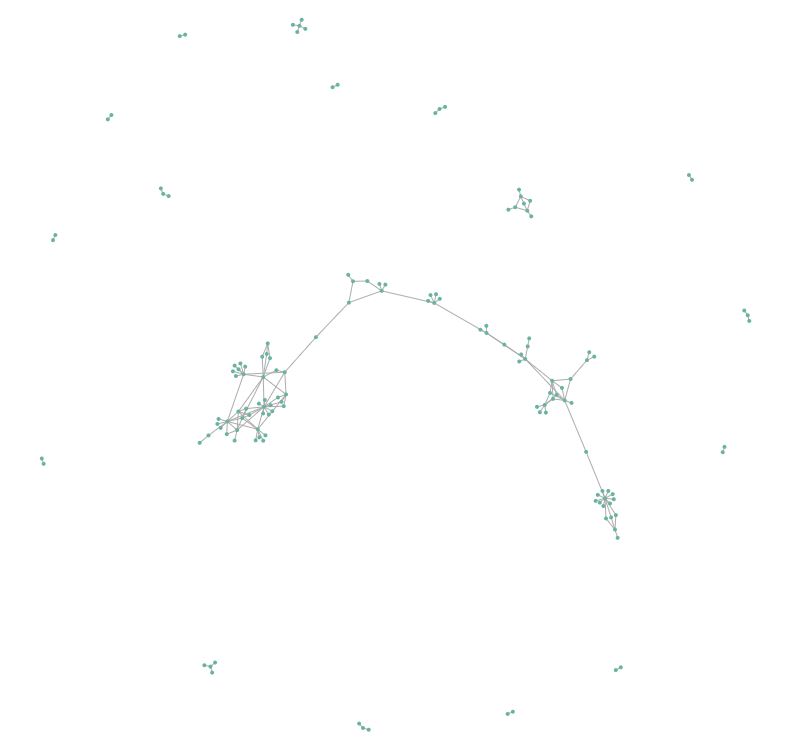
The main problem I had with visualizing this graph is that it’s too large to display as a single image. In order to cover all of the nodes, the camera would need to be zoomed out, and the labels would have to be large enough to see, but also small enough to not cover other nodes. Normally, this isn’t a problem when you can create partial visualizations in an interactive notebook, but not very viable in a blog. As a result, I decided to create an interactive diss track graph in D3.js.
- Hover over a node to see the respective artists, and the artists 1st degree neighbors.
- Double click on a node to toggle on this highlighting. Double clicking on the node (or any other node) will turn it off.
- Zoom with the scroll wheel or by double clicking
- Pan by holding down the mouse and dragging
It takes a few moments for the visualization to render:
Notes:
- The zooming is a bit funky, so I recommend zooming out all the way, and then zooming on a particular section you’re interested in.
- Some nodes look like they’re connected (i.e an edge goes through them), but they aren’t really. You can clarify the relationship by hovering over these nodes.
- You might notice that it would be more proper for this graph to have arrow heads (indicating artist/target relationship). I agree, but creating the other d3 functionality took up too much time, so I tabled it for a later date.
- The color combo used for highlighting nodes is not super aesthetic, but this color combo attempts to be more colorblind-friendly contrasts.
- Here’s what the graph should roughly look like
Data Schema
When the data was collected, the data was organized in tables using “songs” (track name) as a unique identifier. Each diss track would have fields for “artist”, “features”, and “targets”. In terms of constraints, each song has one artist*, and can have multiple features and targets.
* The one artist restriction was a mistake in retrospect.
Table Schema
| track name | artist | features | targets |
|---|---|---|---|
| The Story of Adidon | Pusha T | None | Drake |
| Takeover | Jay-Z | None | Prodigy, Nas |
| Who Shot Ya? | Biggie Smalls | None | 2Pac |
| Hit ‘Em Up | 2Pac | The Outlawz | Mobb Deep, Biggie Smalls, … |
| The Invitation | Nick Cannon | Suge Knight, Hitman Holla, … | Eminem |
| Duppy Freestyle | Drake | None | Pusha T, Kanye West |
Graph Schema
Translating these records (pun) to a graph works like this:
- Each artist, feature, and target exists as node.
- For each song, the “artist” is dissing each of the “targets”.
- For each song, every person in the “features” is dissing each of the “targets”. This assumes that a feature is dissing each one of the targets, which isn’t a fair assumption, but it makes my life a lot easier.
Schema Notes
Music Producers are excluded from this schema, but they are important.
What happened if multiple artists make the same song rather than feature?
Good question (hypothetical audience) - this came as a surprise to me as I didn’t notice that “No Frauds” was the only song in my list that was co-created by Nicki Minaj, Drake, and Lil Wayne.
It’s not correct to say that any of these artists were features because (from my understanding) they had created the song together.
The proper solution would to adjust the artist field so that it can have multiple values, or add another columns representing artist2, artist3, etc. (Something like below)
| track name | artist(s) | features | targets |
|---|---|---|---|
| No Frauds | Nicki Minaj, Drake, Lil Wayne, | None | Remy Ma |
| track name | artist1 | artist2 | artist3 | features | targets |
|---|---|---|---|---|---|
| No Frauds | Nicki Minaj | Drake | Lil Wayne | None | Remy Ma |
However, it felt silly retooling my code for conversions and extractions for this one edge case, so I created three different entities for each artist. (Like below)
| track name | artist(s) | features | targets |
|---|---|---|---|
| No Frauds | Nicki Minaj | None | Remy Ma |
| No Frauds | Drake | None | Remy Ma |
| No Frauds | Lil Wayne | None | Remy Ma |
This solution is terrible for several reasons - you seriously shouldn’t do this, but I’ve deemed this “okay” because I know it won’t matter for the specific use-case I’m thinking about.
Graph/Network Statistics:
Graph construction and analysis was all done in networkx - a python library for working with graphs. While I haven’t worked with large-scale graphs, it’s a pretty great library. Jupyter notebook will be released at a future date.
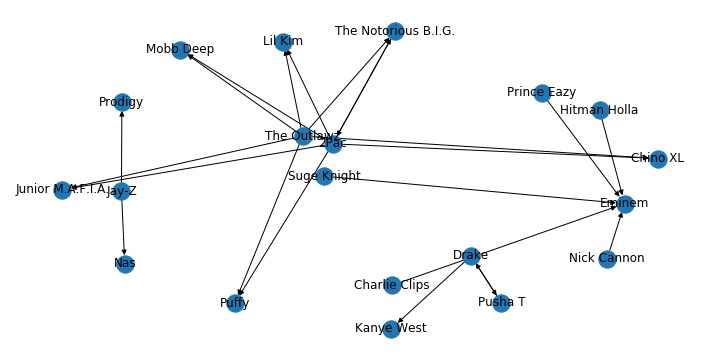
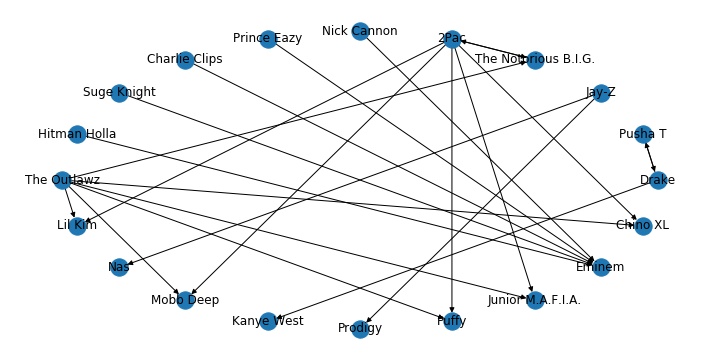
I’ve included both undirected graphs (where the edge weights are equal to the total “track” disputes between artists) and as a directed a graph (where diss track writers/targets are directed edges).
Undirected
- Number of nodes: 143
- Number of edges: 163
- Average degree: 2.2797
- Density: 0.015955875
Directed
- Number of nodes: 143
- Number of edges: 181
- Average in degree: 1.2657
- Average out degree: 1.2657
- Density: 0.008864375
Measure(s) of Centrality
Centrality is a term used to identify the importance of nodes in a graph/network. In the context of this graph, we can think of centrality has artists important to the diss track scene. However, there are multiple metrics used to define centrality, each with a different purpose or use.
Normalized Degree Centrality (Undirected Graphs)
The degree centrality is the number of neighbors a node has. If node A could have edges with 3 other nodes, it’s degree centrality is 3. The normalized degree centrality is the a node’s degree centrality, divided by the number of edges it could have. If there are 100 nodes in a graph, our Node A can have up to 99 connections. Therefore it’s degree centrality is 3/99.
Here are the top 10 rappers by normalized degree centrality.
| Artist | Normalized Degree Centrality (rounded) |
|---|---|
| 2Pac | 0.11268 |
| Eminem | 0.09155 |
| Nas | 0.07746 |
| 50 Cent | 0.06338 |
| Mobb Deep | 0.06338 |
| The Notorious B.I.G | 0.06338 |
| Snoop Dog | 0.05634 |
| Tim Dog | 0.04930 |
| Jay-Z | 0.04225 |
| Common | 0.04225 |
Normalized In Degree Centrality & Out Degree Centrality (Directed Graphs)
The indegree and outdegree centrality have a similar definition to the regular degree centrality. If Node B has 2 incoming edges and 3 outgoing edges it’s indegree and outdegree centrality are 2 and 3 respectively. We can think of “indegree” (number of incoming edges) and “outdegree” (number of outgoing edges) as receiving or giving conflict (i.e being the target of source of a diss track). Having a high indegree centrality means that the artist is the target for a lot of diss tracks from different people. Having a high outdegree centrality means that the artists makes a lot of diss tracks at different people.
| Artist | Normalized Indegree Centrality (rounded) |
|---|---|
| Nas | 0.05634 |
| Eminem | 0.04930 |
| Mobb Deep | 0.03521 |
| Snoop Dogg | 0.02817 |
| Jay-Z | 0.02817 |
| Dr. Dre | 0.02817 |
| The Notorious B.I.G | 0.02817 |
| Lil’ Kim | 0.02817 |
| Eazy-E | 0.02113 |
| Remy Ma | 0.02113 |
| Artist | Normalized Outdegree Centrality (rounded) |
|---|---|
| 2Pac | 0.11268 |
| 50 Cent | 0.06338 |
| Eminem | 0.05634 |
| The Notorious B.I.G | 0.04225 |
| The Outlawz | 0.04225 |
| E.D.I. Mean | 0.04225 |
| Young Noble | 0.04225 |
| Snoop Dogg | 0.03521 |
| Mobb Deep | 0.03521 |
| Drake | 0.03521 |
Katz Centrality
The Katz Centrality is used to measure influence of nodes on a network as a whole. Unlike our previous measures which only rely on 1st degree neighbors, the Katz algorithm also weighs neighbors of neighbors and such. The reason why I picked the Katz centrality (versus Eigencentrality or Pagerank) is because our graph is not strong connected. As a result, only nodes that are in connected clusters or target of such a cluster will have significant eignvector centrality. This means that there are can be some seemingly, unexpected results when ranking results. For instance, Page rank (dampening parameter = 0.8) gives B.o.B and Neil DeGrasse Tyson (the astrophysicist) one of the highest centralitiy measures, despite them only making two diss tracks targeted towards each other1.
The inclusion of Mariah Carey is not a mistake. Even though she’s not in the genre, she’s had diss tracks with Eminem and was married to Nick Cannon for a while. If you’re wondering why the infamous page-rank algorithm wasn’t included, it was because it rated B.o.B and Neil Degrasse Tyson has the among a few other less popular rappers as influential nodes.
| Artist | Katz Centrality (rounded) |
|---|---|
| Nas | 0.13922 |
| Eminem | 0.12581 |
| Mobb Deep | 0.11079 |
| Jay-Z | 0.10953 |
| Lil’ Kim | 0.10514 |
| Snoop Dogg | 0.10514 |
| Dr. Dre | 0.10514 |
| The Notorious B.I.G | 0.10280 |
| Eazy-E | 0.10084 |
| Tim Dog | 0.10012 |
Scraping & Cleaning
I collected the data by scraping these two web pages (a Wikipedia article and a Complex Top 50 List) and parsing their contents into json. Parsing consisted of using BeautifulSoup to find the HTML tags that I needed (easy) and string splits with regular expressions to extract information (annoying).
Afterwards, I merged the datasets and deleted any duplicates.
Data Cleaning
Cleaning the data consisted of adjusting any failures in the extraction process, removing small typos or inconsistencies between the two sites, etc. Even though the data was clearly hosted in a table, the Wikipedia page involved a lot of cleaning because it used plain english to convey information about these songs, meaning finding consistent ways of parsing information difficult. On the other hand, cleaning the complex article was much less work. The page was clean and structured, sorting track names, features, artists, targets very clearly.
There were a lot of little things that I had to clean after I started building the graphs and noticing some strange quirks.
Furthermore I had to decide on exclusions of diss tracks from the WIkipedia article.
Aliases
Aliases needed to be cleaned, for example some tracks had “2Pac” while others had “Tupac”, “Luke” was written as “Luther Campbell” in Wikipedia, and “Notorious B.I.G” was also used for Biggie Smalls. In these instances, I choose the artist stage name over their real name.
Casing, Hyphens, Quotes
Names also had to be cleaned for inconsistent casing, hyphens, or abbreviations. For instance,
- Casing
I’ve seen minor casing incidents where “N.W.A” was written as “N.w.A” or “N.W.A.”.
- Hyphens
“Pusha T” is labelled as “Pusha-T” by Complex, but his twitter and facebook indicate that his stage name is “Pusha T”.
- Abbreviations
Another source of issues was the writing of abbreviations such as “Lil”. For instance, some tracks had Lil Kim as “Lil’ Kim” and others had her as “Lil Kim”. The use of the quotation is inconsistent, for example “Lil’ Kim” twitter and instagram are “Lil’ Kim” while “Lil Wayne”s instagram and facebook are “Lil Wayne”. For these I just removed the single quote, even though it’s technically wrong for certain artists.
Abstract Concepts
Some tracks/records were dissing abstract concepts or entire organizations (“gangster rap” as a genre, record labels, cities). For instance “New York, New York” by “Tha Dogg Pound” disses all NY rappers. I kept it vaguely as “NY rappers” because a follow up diss track “L.A., L.A” disses “That Dogg Pound”. Tim Dogs’s “F*ck Compton” was labeled as dissing the gangster rap genre in addition to the N.W.A - (I removed the diss of gangster rap genre, but I kept the diss towards the N.W.A).
Removals
In addition to fixing aliases and inconsistencies, I choose to remove some tracks from the list for not being sufficiently close to the genre, or having poor information surrounding it:
- Megadeth’s (a heavy metal band) diss track on a former band member.
- Jermaine Jackson’s “Word to the badd!” which is diss track on his brother Michael Jackson.
- Little Mix’s (girl group) “Shout out to my ex” diss track of Zayn Malik
- Black Midi’s (rock band) “ded sheeran” diss track of Ed Sheeran (I can’t even find this song online).
The only song that I’m unsure of removing was “How To Rob” by 50 cent. It’s song where 50 cent talks about robbing and mugging a lot of people in R&B and Hip Hop (like around 50 people). While it would be hilarious to have 50 cent be connected to 50 people from one song, I know that the inclusion of the song was going to skew the results and visualizations (there is a dataset where I include this track though).
Scraping Retrospective
I regret writing a scraper to collect the data. It would have taken an hour (at most) to just copy, paste, and clean these lists myself (Especially considering, I had to clean the end result anyways). I assumed that there would be a lot of data, so that the scraper would pay off, but there wasn’t nearly enough data to justify this approach.
Instead it took me 2 minutes scraping the pages, and 2 hours finding a “clean, systematic” method of extracting data from the pages. At most it would have taken 30 short, but incredibly boring minutes to record this information manually
Things that didn’t make it to the D3 Visualization
Learning how to create D3 visualizations in a “top-down” way can be a painful process (one of the few instances where I would start with a book), so there were things I didn’t implement (but wanted to) for my personal sanity. Maybe you can do them as an exercise!
- Directed Edges
- Edge Hovering that shows tracklist
- Edge Hovering with weights
- Better formatting
- Representing number of interactions as edge thickness
Conclusion & TODOs:
I think they’re is always more to do. There’s definitely a lot to fix, more I can add, different directions to take. For instance:
- Focus on an individual or individuals - rather than a whole genre
- Analyze the graphs more thoroughly - rather than focusing on a few centrality metrics
- Learn more about network analysis
- Finish the D3 vis - with all the bells and whistles
- Try the Genius API - apparently Genius has an API for music. I was thinking that the Genius API could be used to source information and assume its correct.
but I guess that’s a TODO.